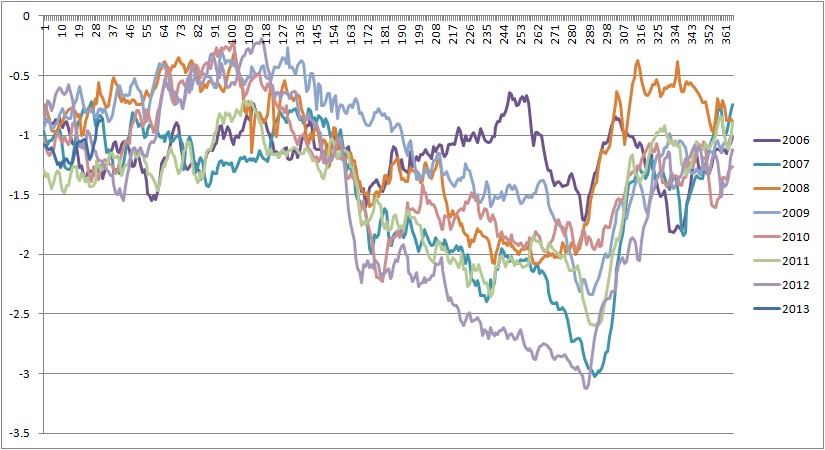
PIOMAS volume anomalies (baseline 1980 to 1999) show the significance of this lag.

The anomalies imply that the gap between this year and the previous two is closing slightly. This could be due to rapid thermodynamic thickening of the first year ice, and as I will show, there is a lot more of that now.
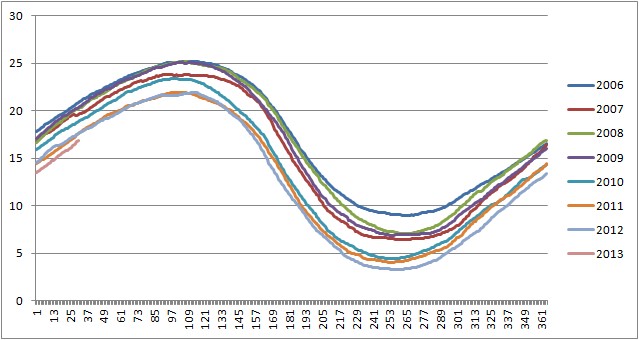
Calculated thickness is the notional thickness calculated by dividing PIOMAS Volume by Cryosphere Today Area, it reflects the above volume anomalies.

And the anomaly of calculated thickness puts the situation in context of the years since 2000.

Cryosphere Today (CT) area anomalies, as expected, show nothing unusual with respect to recent years
They will get interesting come June, when I expect them to crash as in 2012. This has been a feature of recent years, but before I explain why I think the area anomalies will crash I need to outline some more detail, this time from last December.
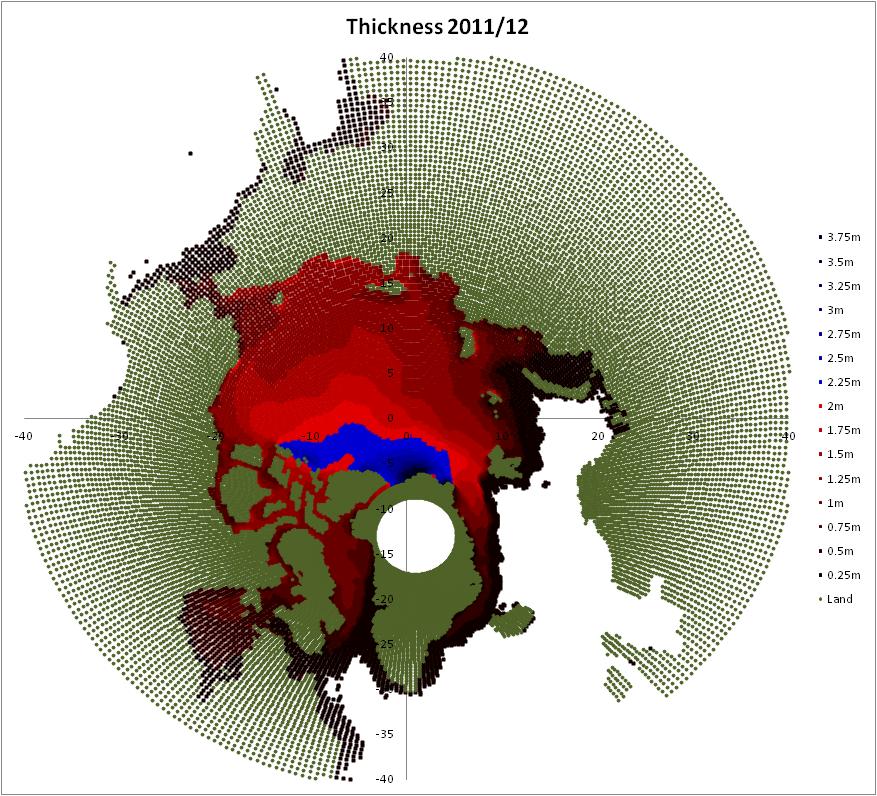
The Fowler/Maslanik/Tschudi ice age plots derived from the Drift Age Model (DAM) have now been incremented, moving ice age on by one year. 2012 shows increased ice in the oldest category, but overall first year ice dominates. Here are December thickness plots generated from gridded PIOMAS data in comparison with the ice age plots for the last three years.
2010 DAM


2011 DAM

2012 DAM
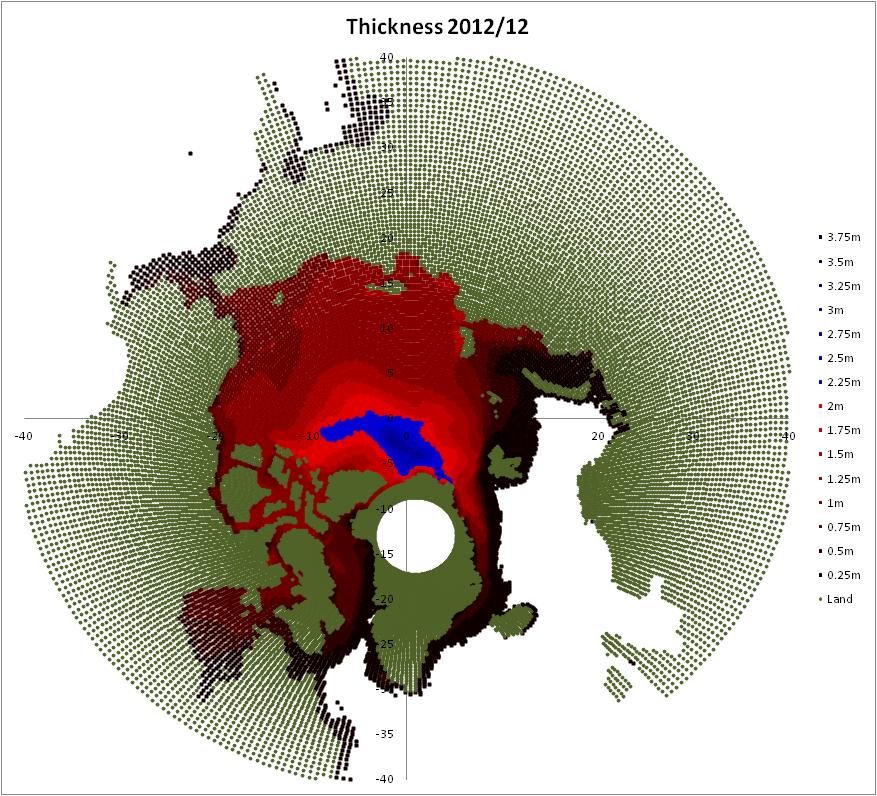
If you think that the pattern of thicker ice in PIOMAS agrees with the older ice in DAM then this is something I've noticed and it seems to hold going back for years. This is to be expected as older ice is thickened by compression and ridging. However what I really wanted to show in the last two images is that in comparison to previous years the ice is now predominantly first year ice. It is not guaranteed that it will melt out, but it is more likely for such ice to melt out than for older ice to do so. The thinness of the ice is also reflected in the very low volume at present. Thickening will continue until April, with the central pack thickening a bit more through to May. It is in June that the general loss of thickness will really begin, with the greatest seasonal loss of volume in July. However for the ice area newly covered by first year ice there will be an increase of about 1/3 energy gain throughout the season. That's before we get to the energy implications of more open water forming, possibly more early in the season.
I suspect that the June crash in CT anomalies is due to increasing amounts of first year ice experiencing massive expansion of surface melt ponds and rapid recession from the edges. If I am correct then the current ice state has the potential to make this June's CT area crash the biggest yet.
Conditions at present, more so than any previous year, suggest to me that 2013 will be a significant year, which will at least meet 2012's record given weather not conducive to ice melt. With weather conditions conducive to ice melt a new record could be set by a substantial margin.
Data sources:
Cryosphere Today Area.
Fowler/Maslanik/Tschudi Drift Age Model plots.
PIOMAS Volume series.
PIOMAS Gridded Data.
No comments:
Post a Comment